

How do we snag that trophy called success, you ask? Well, it's a question that lands in my lap quite a bit, wrapped up in layers of honest curiosity and a sprinkle of hope. But here's a twist—I think the question itself misses the mark. The real go-getters, the ones who are set to make waves, aren't usually the ones sending out SOS signals for a success roadmap.
So, instead of dishing out the usual "10 steps to greatness" spiel that many might expect, I'm taking us down a road less traveled. Welcome to the land of numbers, graphs, and a bit of statistical magic. This is where I plan to shine a light on the oh-so-real reality of where we all stack up in the grand scheme of things.
Armed with the power of normal distribution (trust me, it's cooler than it sounds), I've whipped up three neat graphs to guide our journey. These aren't just any charts; they're your ticket to seeing how human abilities stretch and squish across three wild scenarios: the good ol' present, a theoretical stumble back into the "dark ages," and a leap into a future where AI gives us a leg up.
In a nutshell, normal distribution is a way statisticians describe how traits like human ability are spread out across a population. Most people are average, with fewer folks on the extreme ends of the spectrum.
```python
import numpy as np
import matplotlib.pyplot as plt
from scipy.stats import norm

# Function to plot the distributions with normal curve
def plot_distributions_with_curve(distributions, titles, means, std_devs):
    fig, axes = plt.subplots(1, 3, figsize=(18, 5))
    for i, (ax, dist, title, mean, std_dev) in enumerate(zip(axes, distributions, titles, means, std_devs)):
        # Plot histogram
        count, bins, ignored = ax.hist(dist, bins=30, density=True, alpha=0.6, color='g')
        # Plot normal distribution curve
        xmin, xmax = ax.get_xlim()
        x = np.linspace(xmin, xmax, 100)
        p = norm.pdf(x, mean, std_dev)
        ax.plot(x, p, 'k', linewidth=2)
        title = title + f'\nMean: {mean}, SD: {std_dev}'
        ax.set_title(title)
        ax.set_xlabel('Ability')
        ax.set_ylabel('Density')
    plt.tight_layout()
    plt.show()

# Parameters for the distributions
means = [100, 90, 200]  # Mean for baseline, dark ages and AI future
std_devs = [15, 1.5, 1500]  # Std dev for baseline, dark ages and AI future

# Generate the distributions
human_ability = np.random.normal(means[0], std_devs[0], 1000)
dark_ages_ability = np.random.normal(means[1], std_devs[1], 1000)
ai_future_ability = np.random.normal(means[2], std_devs[2], 1000)

# Plot the distributions with normal curve
plot_distributions_with_curve([human_ability, dark_ages_ability, ai_future_ability],
                              ['Baseline Human Ability', 'Dark Ages', 'AI-Enhanced Future'],
                              means, std_devs)

```
Dive into this number-fueled adventure, give the code a whirl if you're game, and figure out where you dance in the vast conga line of human potential. What's in store isn't just a crash course in stats but a reflection of our collective hustle through time, tech, and those pesky, never-budging laws of probability.
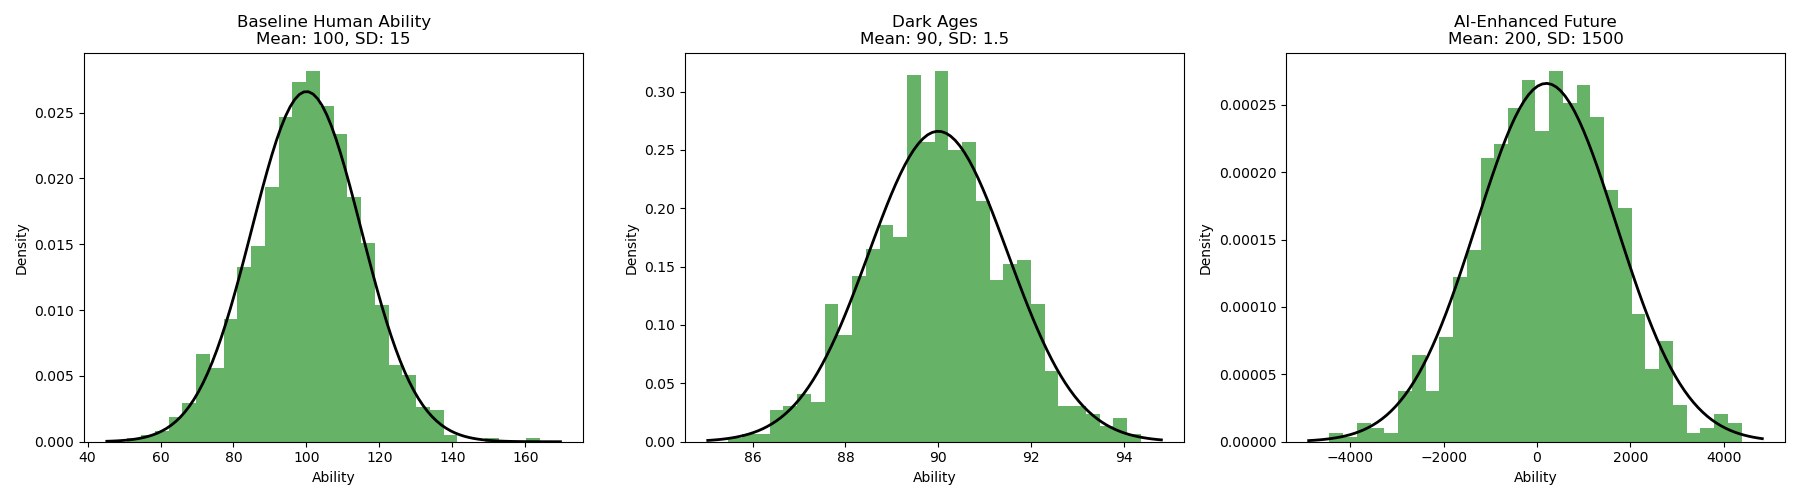
Our Python-powered adventure through graphs brings to life a colorful story of human capabilities set against three dramatically different backdrops: the world as we know it, a hypothetical slide back into darker times, and a bright future turbocharged by AI.
Baseline Human Ability zooms in on the everyday spread of talents and smarts, drawing a picture around a middle ground peppered with folks ranging from the everyday to the extraordinary. It's like the universe's way of saying, "Here's where we all start," laying down the baseline for our collective leaps and bounds.
Dipping into the Dark Ages, we imagine a world where everything's taken a bit of a nosedive. Abilities crowd closer together, hugging a lower average like it's the new normal. But even as the curve shrinks, it tells a tale of resilience, of sparks of brilliance that shine brighter against the dimming light. It's a reminder that no matter how things shift, the human spirit's knack for rising above stays strong.
Then we catapult into the AI-Enhanced Future, where the limits are pushed way off the charts. Abilities aren't just boosted; they're spread out in a grand spectrum of what's possible. It's like the bell curve got a superhero makeover, showing us a world where diversity in talent and potential isn't just preserved; it's celebrated on a grander scale. This future hints at a realm where being exceptional means riding the wave of tech to explore realms we've only dreamed of.
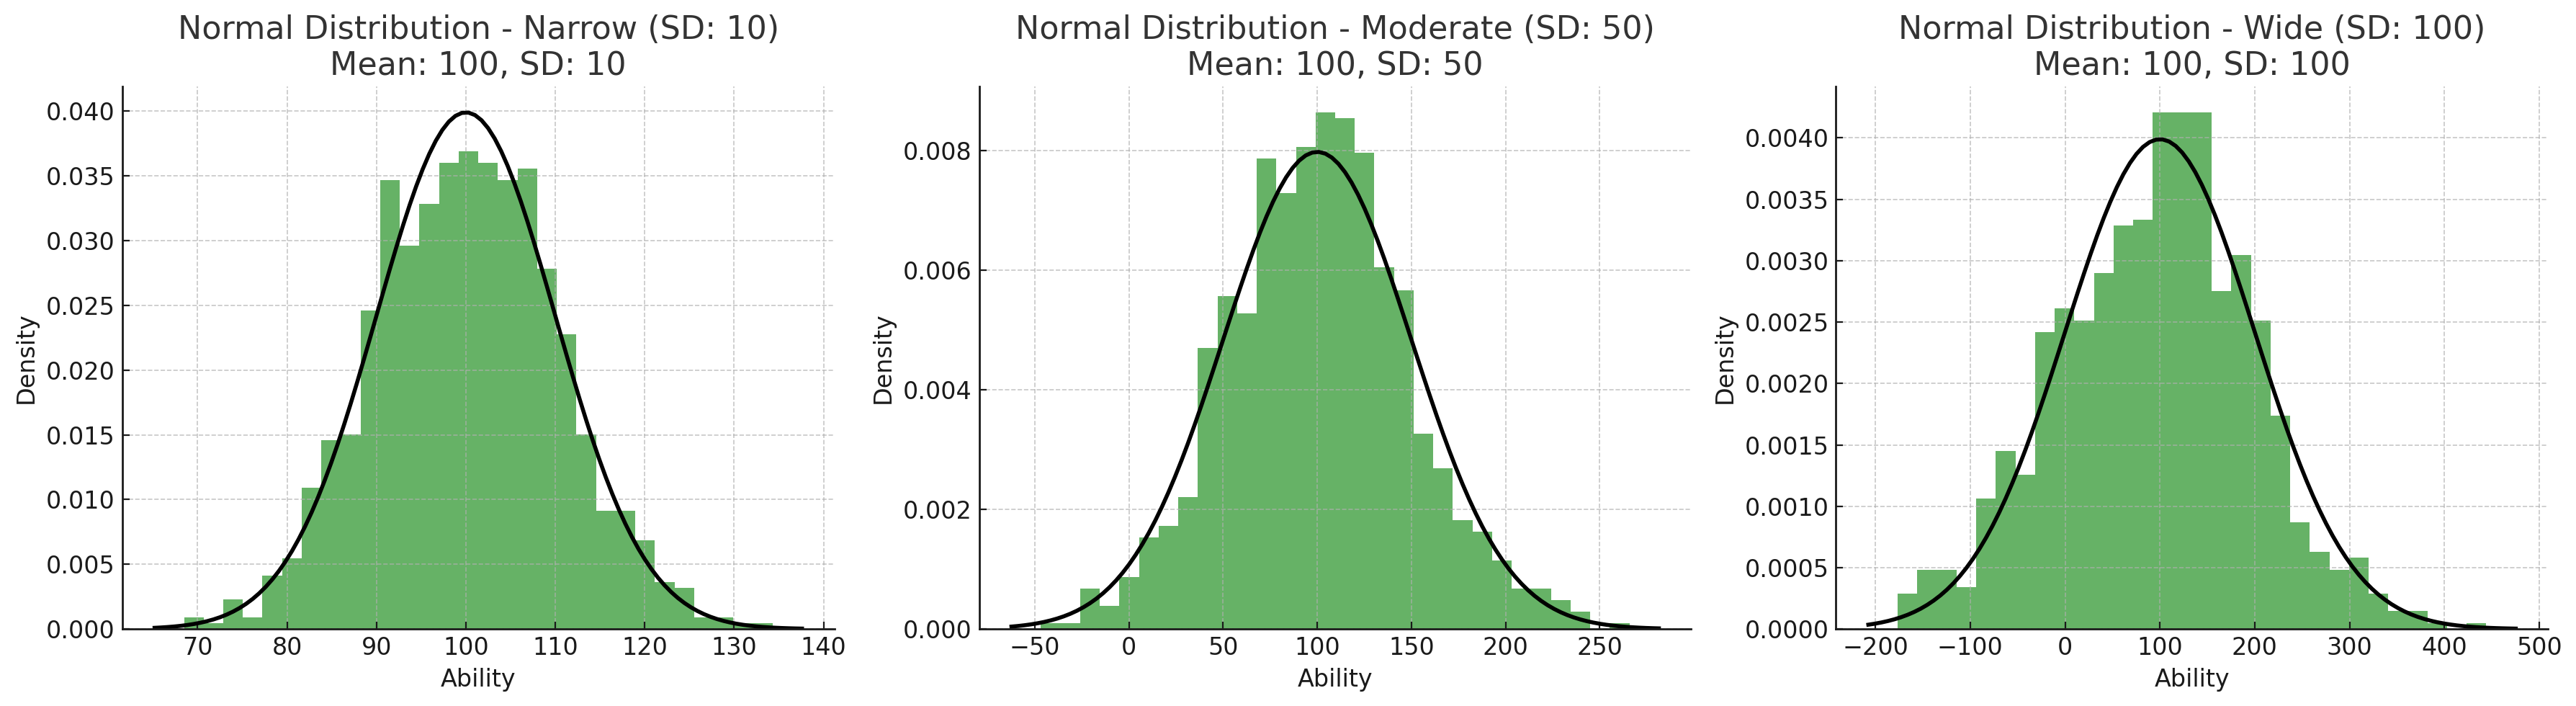
Let's delve into the concept of standard deviation, a key metric in the realm of statistics. It quantifies the degree of variation or dispersion among a set of values. When the standard deviation is low, it suggests that the values huddle closely around the mean, or expected value. On the other hand, a high standard deviation signals that the values are scattered across a broader range, painting a picture of greater diversity in the data.
In the landscape of a normal distribution, approximately 68% of values are nestled within one standard deviation of the mean. Broadening the standard deviation is akin to stretching the canvas of this distribution: the average remains the center point, yet those who are below or above average drift farther from this anchor. The bell curve maintains its characteristic shape, but its tails elongate, signifying an increase in variability and a more pronounced gap between the average and the outliers.
While scaling the standard deviation inflates the zone we deem "average," it doesn't alter the average itself. This inflation results in a wider spectrum of individuals falling into the average category, despite their abilities veering more from the mean compared to a tighter distribution.
In this expanded distribution, the exceptional — those significantly distant from the mean — stand out starkly from the pack. Their abilities are markedly segregated from the norm, accentuating the gulf between the supremely talented or less skilled and the general population.
- The first graph, with a narrow standard deviation (SD: 10), shows a steep curve tightly clustered around the mean. This indicates minimal variation from the average; individuals are mostly similar in ability.
- The second graph, with a moderate standard deviation (SD: 50), begins to show the emergence of longer tails. The curve is flatter, and individuals' abilities are more spread out, indicating greater diversity in the population.
- The third graph, with a wide standard deviation (SD: 100), clearly depicts long tails, where the curve is much flatter and extends over a wide range of the x-axis. This means there's a significant variation in abilities, with individuals much more dispersed from the average, and exceptional abilities are more distinct.
These graphs vividly showcase the effect of amplifying the standard deviation within a normal distribution: a pronounced expansion in the spread of data points and the emergence of elongated tails. Such elongation signifies an increasingly vast gap between the average individual and those who are exceptional, whether in deficiency or proficiency.
But what catalyzes this stretching of the standard deviation? It extends beyond the innate undulations of human talent and capacity. Consider the potent influence of transformative elements like technology—artificial intelligence, in particular. AI has the potential to escalate the boundaries of human capability, propelling both the adept and the nascent to new heights or depths of proficiency. This technological lever can dramatically widen the spectrum of human ability, reshaping the landscape of what is considered exceptional.
Thus, while scaling the standard deviation broadens the spread of values without shifting individuals' relative positions to the mean, it accentuates the distinction between the ordinary and the extraordinary.
To put it into perspective, imagine handing Michelangelo a digital canvas like Photoshop. His innate mastery would likely translate into digital marvels, testament to his place far from the mean on the bell curve of artistic skill. Now, reflect on your own abilities. With access to Photoshop and even AI-driven tools, what can you create? The extent of your capabilities, and the choices you make with the tools at your disposal, might just be encapsulated within that standard deviation.
Friendly reminder: thinking you've got AI image creation down pat simply because you can generate images of pretty girls? That's just scratching the surface, as highlighted here. The core message? While many folks can navigate these tools, genuine expertise is a rarity. There are standout individuals making waves with the same AI technologies, and it's a bit ambitious to consider yourself in their league. If guiding what AI produces is beyond your reach, then you're not even meeting the baseline of what's considered average.
Every AI tool, from GPTs to the forthcoming video innovations like OpenAI's Sora, hinges on how skillfully you can use them. The genuine spellbinding effect happens when you leverage these technologies to forge something genuinely remarkable. It boils down to this: Are you carving out a niche for yourself with your extraordinary application of these tools, or are you just merging into the background? Echoing Bon Jovi's words in "It's My Life," you've got to rise above being "just a face in the crowd" to truly shine in the world of AI.
Each graph isn't just a set of data points; it's a window into our journey as a species, through times tough and transformative, reminding us that while the numbers may shift, the story of human potential and diversity marches on, ever fascinating.
Through these visual stories, we stumble upon a truth that feels both profound and simple: as the world shifts around us, through ups and downs, the overall spread of human abilities keeps its familiar shape. That steadfast bell curve is like a lighthouse, shining a light on the unchanging diversity of what we're all capable of. It's a discovery that shakes up our usual thoughts on success and what it means to be fulfilled.
Grasping the idea of the "constant bell curve" means recognizing that the way abilities are spread out among us isn't swayed by the changing tides of time or the storms of circumstance. This enduring pattern is a vivid reminder of our individual uniqueness and collective identity. The bell curve's persistence tells us that, no matter what happens outside, the essence of our abilities is a constant.
This insight invites us to look deeper: where we find ourselves on this curve isn't just about the hand we're dealt but also about the choices we make and the effort we put in. It's a rallying cry for those dreaming of more than just the average, encouraging us not just to wish for a shift in the curve but to climb higher within its framework.
The heart of the matter is this: as society morphs, the average level of ability shifts too. But while the curve's shape remains unshaken, our individual spots within it are up for grabs. The real magic happens in those moments of change, those critical points where we have the chance to leap forward, using our own drive or the boost from technological leaps.
But, let's not sugarcoat it: the pull of staying put is strong, and true change is a rare beast. Yet, in these times of potential upheaval, there's a once-in-a-generation shot at making a move that could alter your path forever.
Even so, the hard truth is that the allure of the status quo is mighty, and many will keep chasing the same old answers, blind to the transformative chances right in front of them. Are you ready to grab this pivotal moment by the horns, to carve out a new spot for yourself in the grand tapestry of human capability?
Let's face it, I might be overestimating the adventurous spirit in some. The truth is, many choose to stay put. But not me—I'm all set for a leap into the next big thing. Ever heard me rave about the wonders of normal distribution? Here’s the kicker: when you mix a bunch of these distributions together, what do you get? Another normal curve, just waiting to be explored. It feels like we've only peeked at the very beginning of something vast. The real adventure lies in how many more leaps we're eager to make.
And yes, I'm making that jump, ready to soak in everything new and evolve, just as I did with the last curve. Aiming for the extraordinary, once again. The journey? It's a loop that spins endlessly, each turn offering a fresh start.
So, if you're still pondering how to nail success, I wish you all the best on your current bell curve. Meanwhile, I'm off to navigate the next curve, chasing the thrill of endless possibility and growth.
The world is ever-changing, and so are the curves we navigate. Embracing continuous learning and being open to adaptation are your best tools for not just surviving but thriving in the waves of change.
As we stand at the crossroads between eras, remember that our choices and actions define where we end up on this spectrum. It's not just about adapting to change but actively shaping our destiny within it.
Here's the real kicker: Countless potential Michelangelos are getting lost in the mix, either too comfortable with their current achievements or avoiding new tech like the Luddites of yesteryear. Imagine leapfrogging over these Michelangelos to become an icon in the age of AI. Truth be told, with some dedication and effort, you could close the gap between you and these tech-averse geniuses in no time. I'm on that path myself, showing it's within anyone's reach. So, why not you?
This shift is happening right now. The big question is, are you ready to make the jump?